 Google Ads
You open Google Ads, see a respectable return and then look at what the business has actually kept. The two pictures don't seem to belong to the same shop.
It's tempting to raise the target and hope that sorts it. But a higher target won't tell you which products earned their keep, whether the revenue figures agree or how much demand was already there.
The useful question is what happened between the advertising result and the fulfilled order. Follow that trail before deciding whether to change bidding, the products you promote, the buying information or the offer itself.
First, work out what the order left you
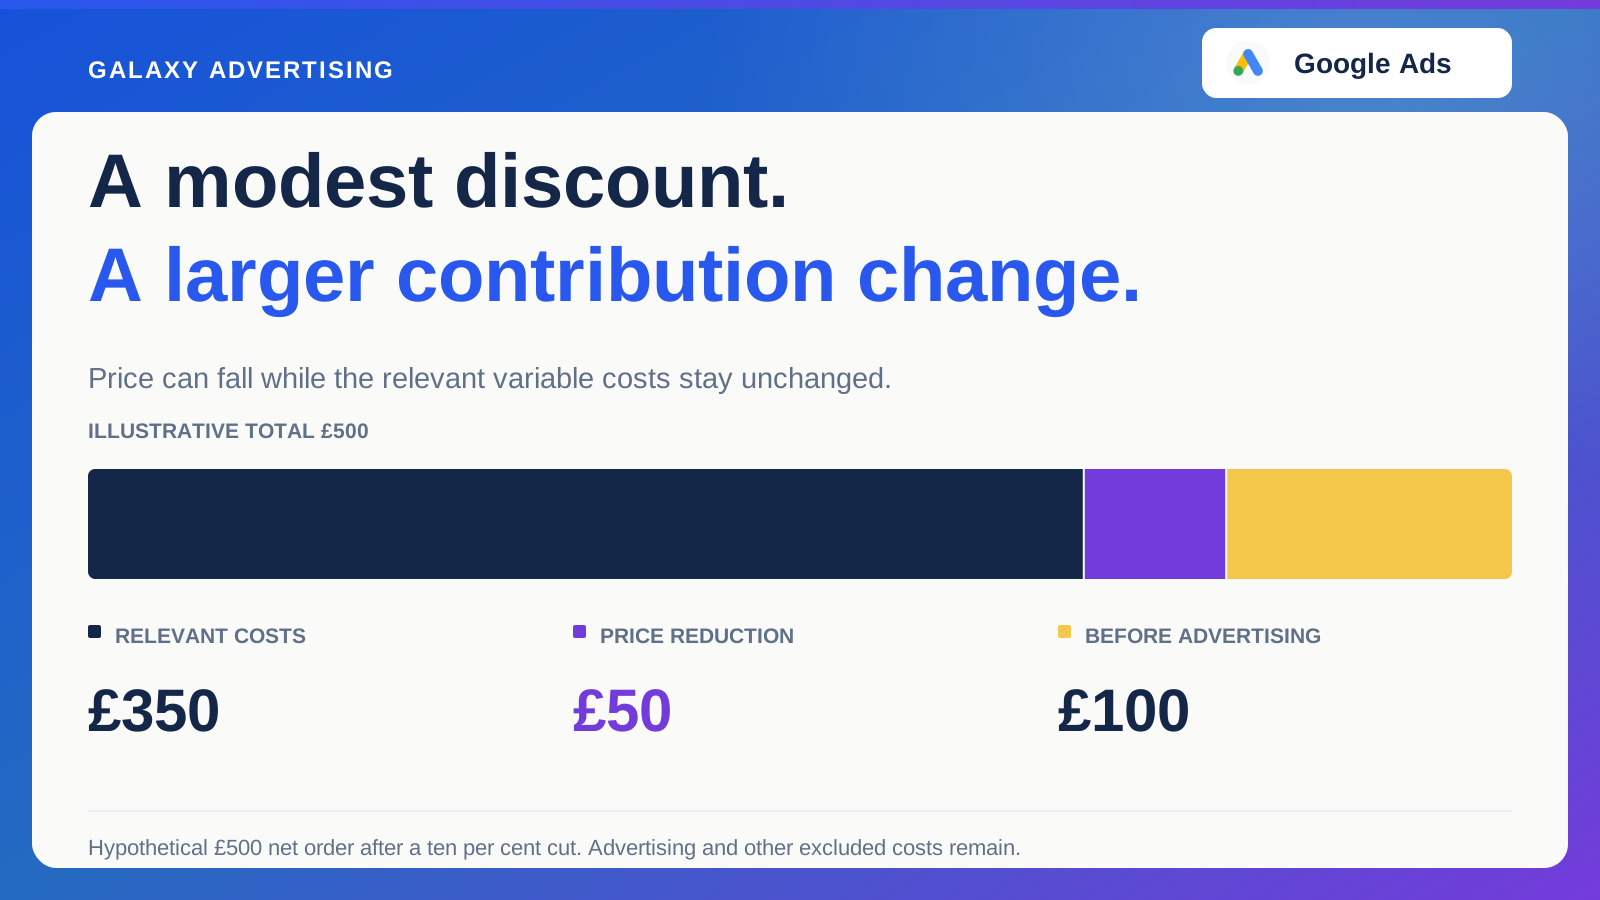
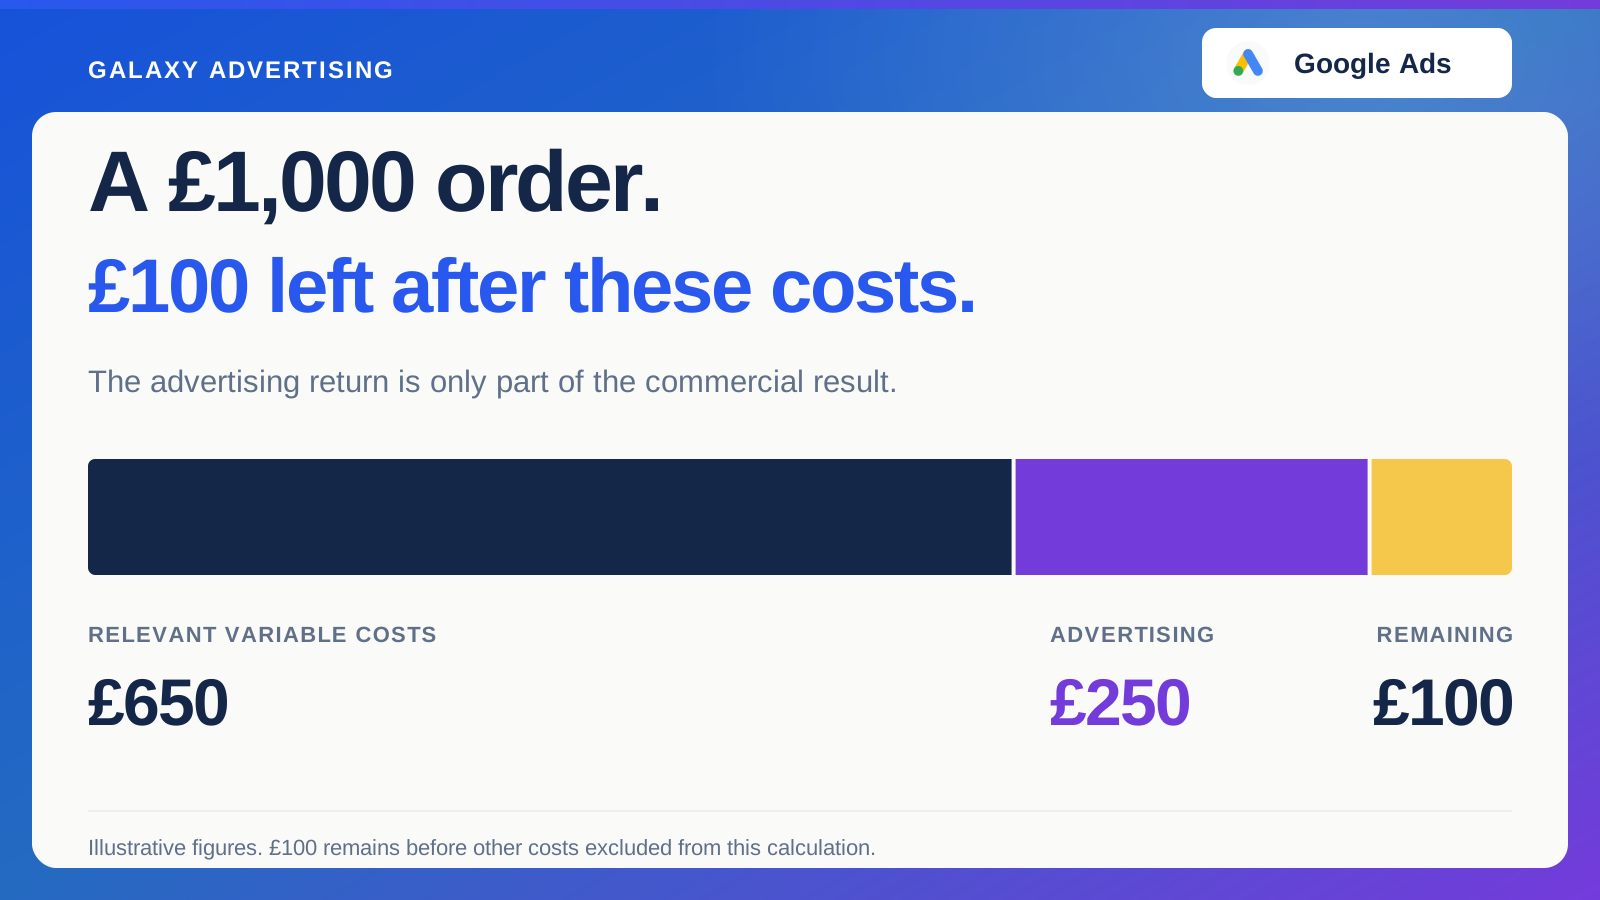
Take this illustrative example. You're looking at a £1,000 net order with £650 of relevant variable costs, the costs that change when you take an order. That leaves £350 before advertising and any costs excluded from this calculation.
Spend £250 acquiring it and £100 remains on that basis. Spend £400 and you've used £50 more than the available contribution, meaning the money left after those relevant variable costs.
Same order. Rather different feeling.
These are hypothetical figures, not recommended targets. Their usefulness depends on agreeing what went into them. If the advertising system includes tax and delivery income but your accounts use net product revenue, don't casually compare their ratios. Settle how you treat discounts, cancellations, refunds and shipping first.
Then name the relevant variable costs. Depending on your business, these could include product cost, payment processing, packing, delivery subsidies and expected return handling. Keep those assumptions visible. Calling something “margin” doesn't help much if merchandising and finance are talking about different sums.
How much can you afford to spend getting that order?
Suppose the illustrative business wants to keep £150 of its £350 contribution after acquiring the customer. That gives it £200 to spend on advertising. Divide £1,000 revenue by £200 and you get a 5:1 revenue to advertising cost ratio for these particular assumptions.
That ratio is often called return on ad spend, or ROAS: the revenue attributed to each pound spent on advertising.
This is a reference point, not an instruction to set every campaign target to five. A bidding instruction, an account average and the allowance on an order describe different things. Your account structure, conversion values and available evidence determine how you can sensibly use that reference.
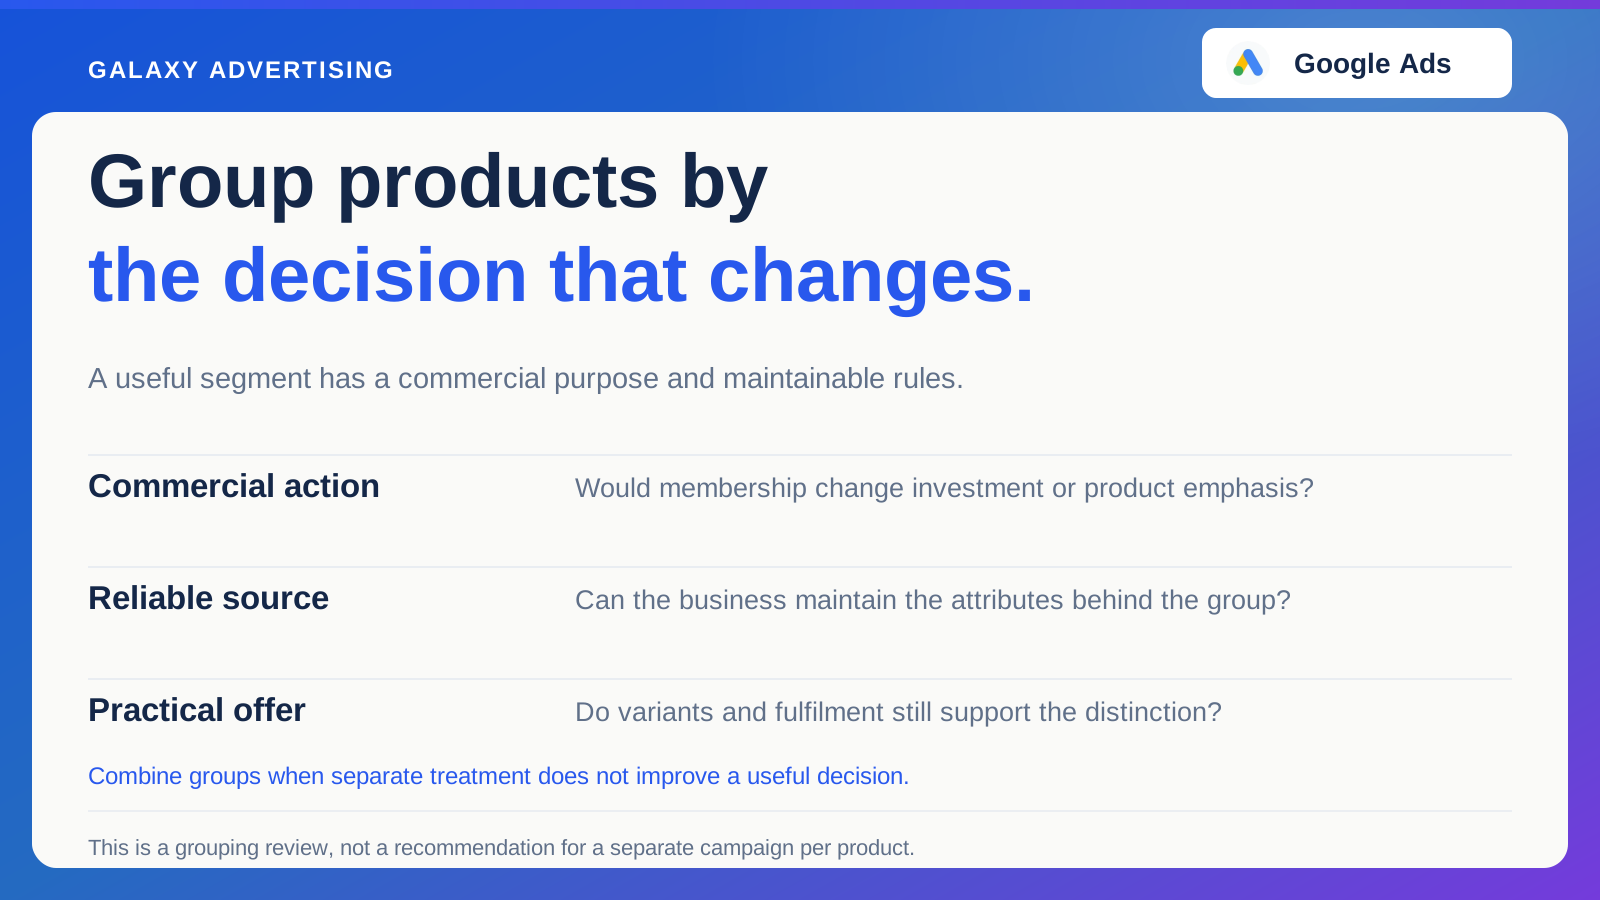
Repeat the calculation for product groups with meaningfully different economics. A stocked accessory and a bulky item needing specialist delivery can leave very different amounts behind. Blend them and one group can conceal the other's weakness.
You don't need hundreds of tiny groups that become somebody's permanent spreadsheet problem. Separate differences big enough to change where you would invest.
Were you finding customers or catching existing demand?
Look at revenue associated with searches for your brand, returning customers and broader category demand. These help explain the result. They don't perfectly measure additional sales.
Someone who already knows your store can be easier to convert than someone comparing unfamiliar retailers. If existing demand dominates, the account can look efficient without showing that wider customer acquisition is equally strong.
The reverse matters too. An unfamiliar customer could discover you, return another way and then order. A simple report can undervalue that first interaction.
Give both possibilities room. Branded advertising isn't automatically pointless. Equally, its attributed revenue doesn't prove you can expand the whole account without changing the customer mix.
Which products are doing the heavy lifting?
Export a manageable sample of advertised products and match spending with orders, availability and your contribution assumptions. Start where meaningful money is going and where results look unusually strong or weak. Find an explanation before excluding whole groups.
Perhaps the popular configuration isn't available. Perhaps a missing specification leaves people comparing rather than buying. Or perhaps specialist delivery makes apparently good revenue less attractive.
Those are different problems. A bid change can blur them together.
Check the connection between your product data and the destination too. Google's product data guidance is useful for accurate prices, availability and variants, the sizes, colours or configurations you sell. It doesn't decide whether acquiring customers for that item makes commercial sense. That remains your assessment.
Trace a few orders before moving the target
Choose a small set of orders that materially affected the reported result. Identify the advertised product, recorded conversion value, eventual order status and relevant cost group for each.
When values differ, investigate before declaring either system wrong. A later refund, a different treatment of delivery income and an incorrectly mapped event need different corrections. You save time by finding the cause rather than arguing over which dashboard wins.
Ask your account manager to connect the observation with the proposed action. If they recommend increasing a target, which product economics justify it, and what effect on demand do they expect? If they recommend fixing product information or its destination, what mismatch have they found?
This doesn't have to become a manual audit of every order forever. You're checking the assumptions behind the summary before using them to control a larger investment.
Make the review earn its place in the diary
Use a short table showing product group, spend, consistently defined revenue, relevant variable costs and contribution remaining after advertising. Note material changes in stock, price or fulfilment. Label estimates as estimates. Nobody benefits from a guess wearing a decimal point.
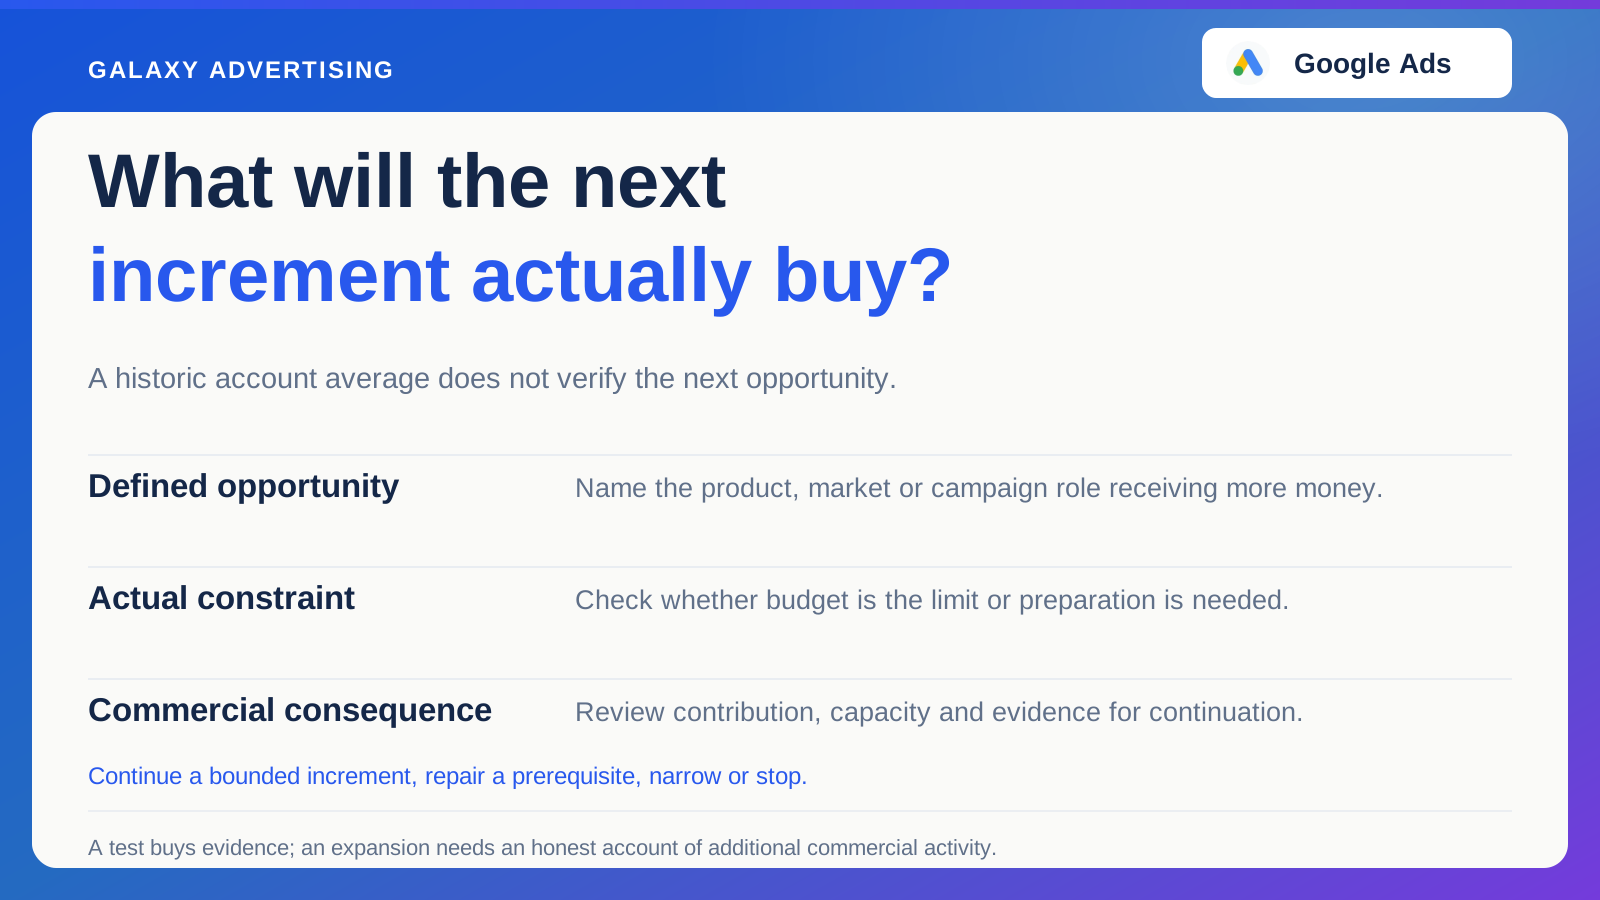
Choose one decision: repair information for a suitable product, reduce emphasis on an unsuitable group, investigate reporting differences or test a broader source of demand. Give someone responsibility and agree what check will show whether the correction worked.
Keep the commercial assumptions behind the target on record. A supplier cost change can make yesterday's acceptable acquisition result unacceptable while the advertising dashboard barely moves. That's a business change, not necessarily an account management failure.
A worthwhile Google Ads result should survive the journey from dashboard to fulfilled order. The figure worth defending is the contribution you can explain and still use to run the business.